Understand the way your home uses and loses heat and identify ways to save more energy throughout the year.
Understanding Home Efficiency
Drafts, uneven temperatures, and high bills are signs of an inefficient home. In many cases, heating systems work overtime to compensate without making a home comfortable and still allowing heat and money to escape. Homes can be kept warmer in the winter and cooler in the summer by adding insulation, sealing air leaks, improving windows and doors, and upgrading mechanical systems. These upgrades can lower utility bills, while making homes more comfortable.
How Your Home Works
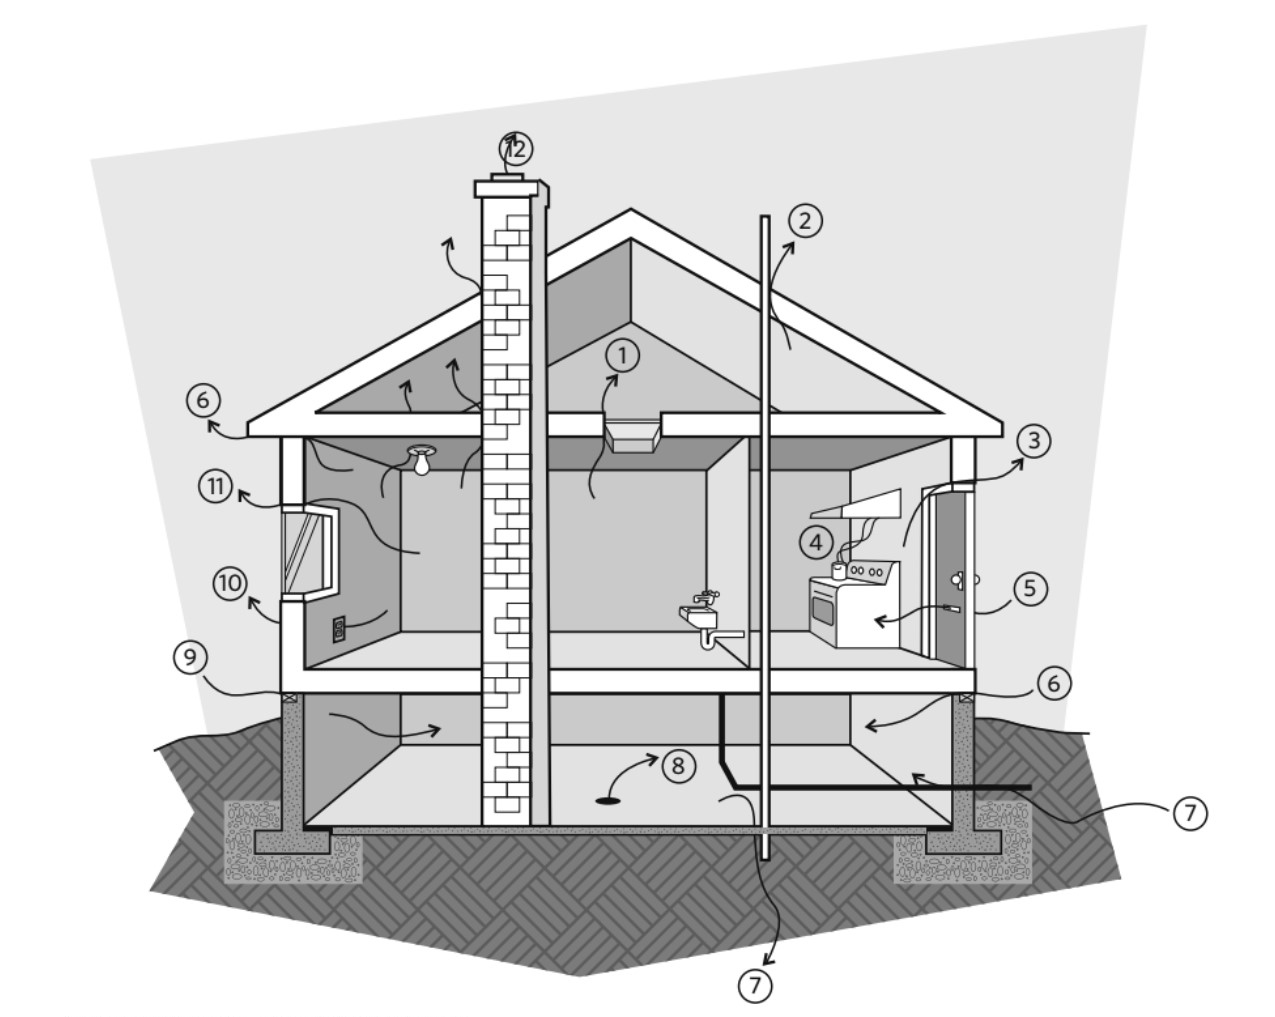
When addressing home heat loss, you first need to consider the building's envelope and where it might be letting heat escape. Think of it as the shell of your house, separating the indoors from the outdoors. The building envelope consists of doors, windows, walls, roof, and basement or crawlspace. To maintain a comfortable and efficient living space, it must effectively control the flow of heat, air, and moisture in and out of your home.
Heat Flow
Heat moves from warm to cold areas through materials (conduction), liquids and gases (convection), or in a straight line heating anything solid in its path that absorbs energy (radiation). When minimizing heat flow, focus on insulation in the home's roof, walls, floor, and basement and avoid gaps in the insulation or building envelope (thermal bridging).
How much insulation do I need?
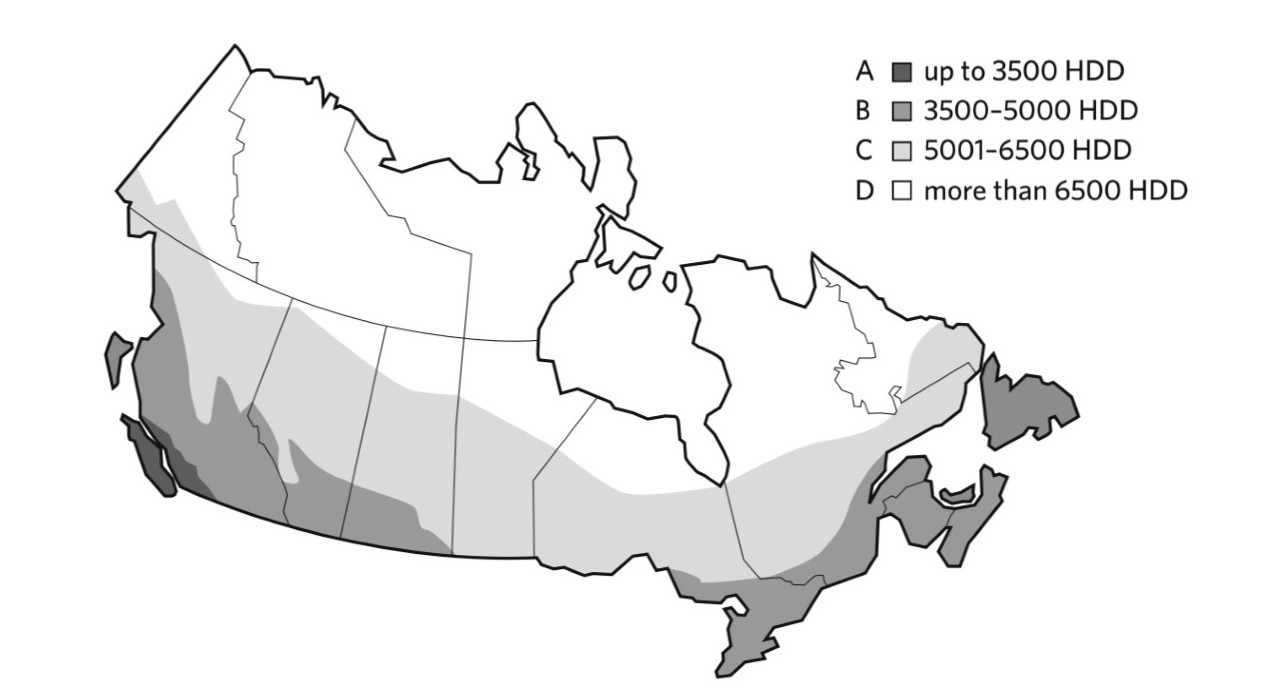
Canada Insulation Map: Heating degree-day zones (HDD) and recommended minimum insulation values. Zones by HDD: A) up to 3500HDD, B) 3500-5000 HDD, C) 5001-6500 HDD, D) more than 6500 HDD. Source: Natural Resources Canada - Keeping the Heat In
Nominal insulation values in metric (RSI) and imerial (R) units for house walls, basement, roof/ceiling and floor in different Canadian zones (A,B,C,D).
House Component
Metric (RSI) or Imperial (R)
Nominal Insulating Value
Zone A
Zone B
Zone C
Zone D
Walls
RSI
3.9
4.2
4.8
7.1
R
22.0
24.0
27.0
40.0
Basement
RSI
3.3
3.3
4.2
4.4
R
19.0
19.0
24.0
25.0
Roof or Ceiling
RSI
7.1
8.8
10.6
10.6
R
40.0
50.0
60.0
60.0
Floor
RSI
4.8
5.5
7.1
8.8
R
27.0
31.0
40.0
50.0
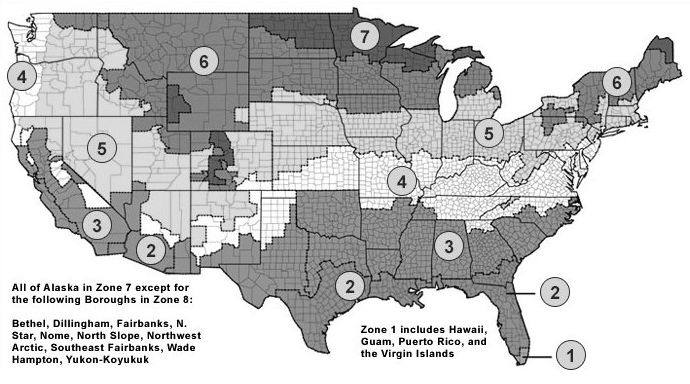
US Insulation Map: Recommended insulation levels for retrofitting existing wood-framed buildings. Zone 1 is in Florida, with zone numbers increasing with latitude up until Zone 7, in the Minnesota and North Dakota region. All of Alaska is in Zone 7 except for Bethel, Dillingham, Fairbanks, N. Star, Nome, North Slope, Northwest Arctic, Southeast Fairbanks, Wade Hampton, Yukon-Koyukuk. Zone 1 includes Hawaii, Guam, Puerto Rico, and the Virgin Islands. Source: Energy Star - Recommended Home Insulation R-Values.
Insulation values (R) for house components, including attic (uninsulated), attic (3-4 inches of insulation) and floor, in different US zones (1 to 5).
House Component
Zone 1
Zone 2
Zone 3
Zone 4
Zone 5
Attic (Uninsulated)
R30 to R49
R30 to R60
R30 to R60
R38 to R60
R49 to R60
Attic (3-4 inches of insulation)
R25 to R30
R25 to R38
R25 to R38
R38
R38 to R49
Floor
R13
R13 to R19
R19 to R25
R25 to R30
R25 to R30
Actions to take when exterior siding is removed on an uninsulated and insulated woo-drame walls.
Wall Insulation
Whenever exterior siding is removed on an uninsulated wood-frame wall:
drill holes in the sheathing and blow insulation into the empty wall cavity before installing the new siding, and
Zones 5-8: Add R5 to R6 insulative wall sheathing beneath the new siding.
Zones 3-4: Add R5 insulative wall sheathing beneath the new siding.
Whenever exterior siding is removed on an insulated wood-frame wall:
Zones 4-8: Add R5 insulative sheathing before installing new siding.
Did you know? Insulation is labelled with an RSI or R-value. Both rate the material's ability to resist heat flow. The higher the value, the slower the rate of heat transfer through the insulation.
Air Flow
Air leaks through gaps in the building envelope when there is a difference in air pressure between the inside and outside of the home. When minimizing air flow, focus on leaky windows and doors, poor sealing around plumbing and electrical penetrations, and consider adding wind barriers under the exterior wall finish.
Did you know? Air leaks can be a significant source of heat loss. In a typical house, all of the holes and gaps can add up to an opening equivalent to a medium-sized window left open 24 hours a day.
Moisture Flow
Moisture originating from the outside (precipitation or flooding) or inside (water vapour from occupants) can damage your home and impact its durability. When minimizing moisture flow, focus on drainage around the home, the vapour barrier on the warm side of the insulation, and limit moisture created indoors.
How much moisture is produced by indoor activities?
Moisture Added to the House Through Various Household Activities (For a Family of Four)
Activity
Moisture Produced (L)
Cooking - three meals daily for one week
6.3
Bathing - 0.2L per shower of 0.05L per bath
2.4
Clothes washing (per week)
1.8
Floor mopping per 9.3 square meters (100 square feet)
1.3
Normal respiration and skin evaporation from occupants
38.0
Total moisture production per week
49.8
Source: Natural Resources Canada - Keeping the Heat In
Did you know? Humidity levels should be between 20% and 40%. 20% and above can prevent dry, sore throats, and make the air feel warmer and more comfortable. Levels above 40% can cause frosting and fogging of windows, staining of walls and ceilings, peeling paint, mould growth, and odours.
Interpreting Heat Loss Details
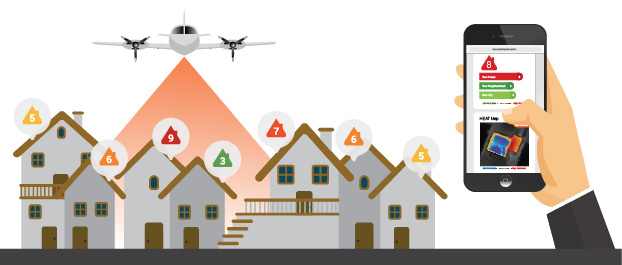
MyHEAT at a Glance
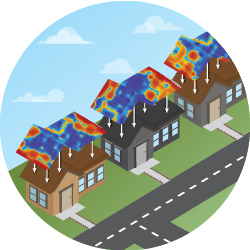
MyHEAT is empowering urban energy efficiency™ by helping people see and compare where heat is escaping from their homes and cities. Our unique machine learning process creates powerful visuals and scores that reveal invisible energy loss.
Collecting Data
We collect data at night using a thermal sensor attached to a plane. Nighttime collection ensures that the sun is not impacting the roof's temperature reading. Flyovers also take place in the spring or fall when the weather is cool, dry, and there is minimal wind.
Revealing Heat Loss
Once thermal data is collected, MyHEAT applies a unique machine learning process to pick out and compare each roof's heat loss signature. All roofs can be compared as if they were collected at a single moment in time, allowing us to look at heat loss over different years and between houses, communities, and cities.
Understanding Your Energy Loss Map and Comparison Score
Our platform helps users learn about their home's heat loss. Each home's profile includes a unique Energy Loss Map and Comparison Score and then connects the user to local rebates and resources to help them save energy.
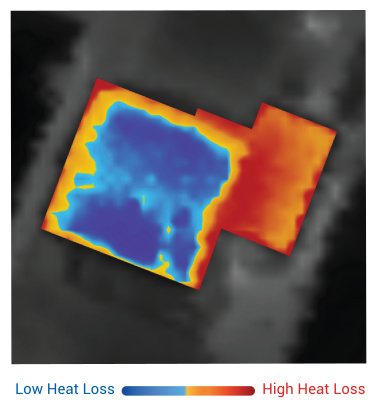
Energy Loss Maps
Images showing the thermal characteristics of a home. Red shows areas where more heat loss may be occurring.
Comparison Score
A rating of how much heat a building is losing compared to similar homes on a scale of 1 to 10. The higher the rating, the more energy is being wasted.
Hear From Other Homeowners
Homeowner Experience Videos
Hear what homeowners had to say after viewing their homes on the MyHEAT platform!
Interpreting an Example Home
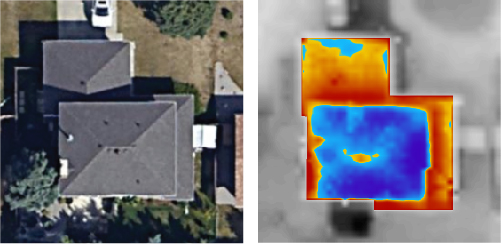
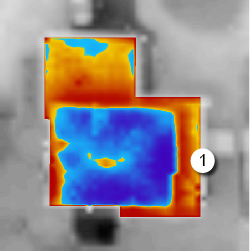
The HEAT Map on the right shows heat loss for the house on the left ‒ a typical two storey home with an attached garage built in 1976.
The owner of this home was very familiar with their energy use and efficiency. When they saw this image, some of the heat loss areas immediately made sense. For instance, they had:
Upgraded attic insulation on the second floor, where the image shows low heat loss (blue area), but
They had not upgraded insulation on the first floor, where the image shows high heat loss (red area along right side).
However, they were curious about other areas of heat loss - specifically the red area above their attached garage, shown on the north side of the home. To investigate further, they contacted a local energy advisor to evaluate the home.
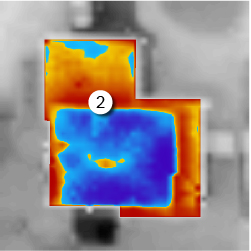
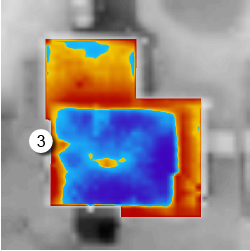
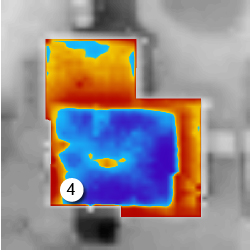
Here is what the energy efficiency expert found:
Poorly fit insulation in the first storey ceiling and heavy thermal bridging in the living room and dining room, as suspected by the homeowner.
No insulation and improper air sealing around plumbing and electrical penetrations along the north wall between the house and garage, allowing heat loss into the uninsulated garage.
An unsealed B-vent on the west wall, allowing warm air to leak up the chase wall which was unsealed at the attic level.
Poor sealing of a newly installed gas fireplace insert to the existing chimney.
Interested in seeing more homeowner case studies? Learn more on our Case Studies page.
Quick Tips to Save Energy
Explore resources in your area:
If available in your area, take a look at your home profile to discover potential heat loss areas and see how your home compares to similar homes in your city. Once finished, contact your local utility or government agency to learn about rebates that may be available to help you save energy.
Complete a detailed home evaluation:
Contact a local energy advisor to get professional insight into your home's energy performance. They will complete a detailed audit of your home to help you identify problem areas and recommend the next steps for action.
Upgrade insulation:
If your home is more than 15 years old, it is likely under-insulated compared to current standards. Look for opportunities to add insulation to your attic, walls, and basement. Increasing your home's insulation is one of the fastest and most cost-effective ways to reduce energy waste.
Install a programmable thermostat:
Stop heating an empty or sleeping house. By installing a programmable or smart thermostat, you can automatically adjust the temperature and save up to 15% on your heating needs. Additionally, avoid heating unused rooms by closing vents and doors.
Eliminate drafts around attic hatch:
Even if your attic is already insulated, the pull-down hatch is often left without protection. A surprising amount of heat can escape through those leaky doors. Make sure this area is insulated and gaps are sealed.
Seal electrical outlets:
Place your hand in front of an outlet on a cold day. If it is cold, carefully remove the cover after turning off the power to insulate your outlets. Use caulking to fill gaps around the outside of the box and insert a foam gasket specially made for insulating outlets.
Seal plumbing penetrations:
The places where pipes enter and leave your living space need to be sealed with foam or caulk - builders sometimes neglect this step. Check in your basement ceiling and inside cabinets, as well as exterior walls.
Caulk around window frames:
Windows can be the weakest points in your home's envelope. Remove old cracked caulking and replace it with fresh caulk. Combined with lined drapes or blinds, this will address one of your home's greatest points of heat loss. Also consider replacing old windows with newer, energy-efficient ones.
Adjust door thresholds:
Can you see daylight under exterior doors? Some thresholds are adjustable with screws: turn them counterclockwise to close the gap. You could also buy or make a “draft snake” to place across the draft at the bottom of a closed door. Also, check the weatherstripping around your doors and replace if it looks worn.
Replace your flue damper:
Most of us know to close the damper on our fireplace whenever it is not in use to reduce heat loss through the chimney - but a lot of warm air still escapes. Some dampers fit poorly and provide little protection from draft; a snug-fitting damper may save 8% of fuel costs.
Questions? Download our free guide to understanding your home's heat loss.
We use cookies on this website. By using this site, you agree that we may store and access cookies on your device. See our Privacy Policy for more details.
You appear to be using an older browser. We suggest using the latest version of Google Chrome, Mozilla Firefox, Apple Safari or Microsoft Edge for an optimal experience.